Step 7 - View Reports
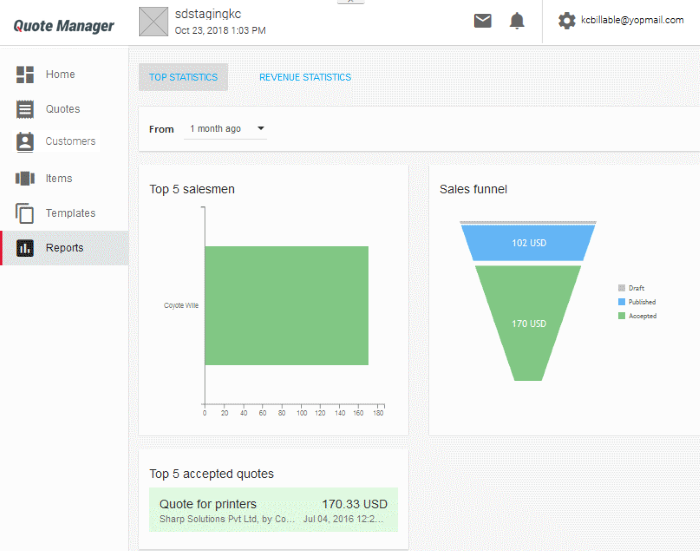
- The 'Reports' screen contains statistics and charts about quote statuses, sales and revenue.
- All revenue and sales data in the dashboard is derived from the value and acceptance status of your QM generated quotes.
- Click 'Reports' on the left, to open the dashboard

- Top Statistics - Displays total revenue generated by top 5 accepted quotes, lists the top 5 quotes by value and shows a funnel of the value of all generated quotes according to their life-cycle status.
- Revenue Statistics - Displays monthly, cumulative monthly and average monthly revenues. This section also shows the average time to close a quote.
Tip: To make the sales funnel more accurate, you may want to 'Withdraw' any test or otherwise unwanted quotes that have 'Draft' or 'Published' status. To do this, click on a quote in the main 'Quotes' interface to open its detail page, click menu icon at top-right then select 'Withdraw':


