ITarian Help

Find the desired product help

ITarian

ITarian

Service Desk V2 Staff Guide

English

Print Help
Service Desk Staff Panel > Staff Panel Dashboard > View And Manage Reports
  • Introduction To Service Desk V2 Module
    • Login To The Service Desk V2 Module
  • Service Desk Staff Panel
    • Staff Panel Dashboard
      • View Dashboard Reports
      • View And Manage Reports
      • View Statistics
    • Manage Users And Organizations
      • Manage Users
      • Manage Organizations
    • Manage Tickets
    • Manage Tools
      • Canned Response
      • Create And Manage Knowledge Base
    • View Report

View and Manage Reports


  • Ticket summary metrics provides an overall number of tickets created, tickets reopened and tickets closed

  • The graph displays the number of tickets handled by the agent on monthly basis.

  • The report can be viewed for a day, week, month or years by entering the start date and end date.


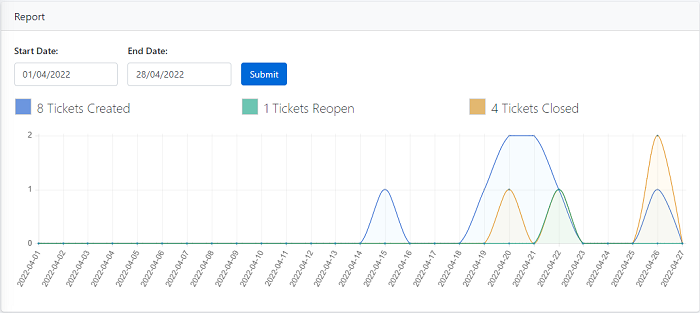
  • The blue colour denoted for tickets created and the number of tickets, green shows the total reopened colours and orange colour used for total number of closed tickets.
  • Move the cursor in the chart to view the tickets created in a particular day

For example, if your date range is from 01/03/2022 to 01/04/2022, the graph will display a single data point that is the summation of data from March 1 2022 through April 1 2022.

Comodo Help
  • IT Platform:
  • Help
  • Scripts
  • Wiki
  • Forum
  • Developer
  • RMM
  • Patch Management
  • Service Desk
  • ITSM
  • Managed Service Provider
  • Managed Detection and Response
  • Ticketing System
  • Helpdesk
  • ITIL

Copyright 2025 Itarian