


View Scan Logs
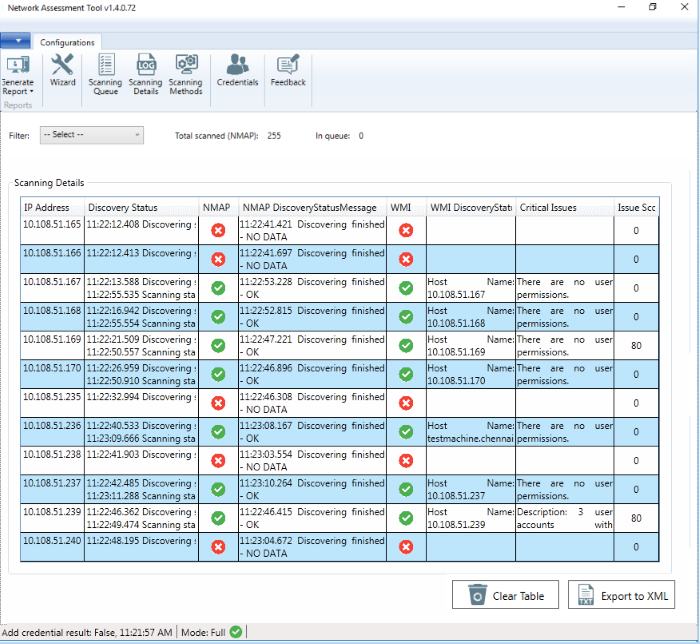
- The 'Scanning Details' interface lets you view logs of currently running and recent scans.
- The logs provide information on the IP address scanned as per the domain, workgroup or the IP address range chosen for scanning, endpoints discovered at the IP addresses, a summary of critical issues identified from the endpoints and the issue score of the endpoints.
- The logs can also be saved as an XML file for later analysis.
|
Note: The 'Scanning Details' interface will be available only if logging is enabled for the Network Assessment Tool application. See Configure Network Assessment Tool for more details. |
- To
view the scan logs, click 'Scanning Details' from the menu bar.
|
Scanning Details - Column Descriptions |
|
|---|---|
|
Column Header |
Description |
|
IP Address |
Indicates the IP address scanned. |
|
Discovery Status |
Indicates the precise time at which the IP address was scanned for assets and the status. |
|
NMAP |
Indicates whether an asset, like an endpoint, server or any other network device was identified at the IP address by NMAP tool. |
|
NMAP Discovery Status Message |
Indicates the precise time NMAP tool was running discovery scan on the IP address and displays the result of the scan. |
|
WMI |
Indicates whether an asset, like an endpoint, server or any other network device was identified at the IP address by WMI tool. |
|
WMI Discovery Status Message |
Indicates the precise time WMI tool was running discovery scan on the IP address and displays the result of the scan. |
|
Critical Issues |
Displays a summary of critical issues identified at the endpoint, at the IP address. |
|
Issue Score |
Displays the score assigned to the endpoint by NAT, based on issues identified at the endpoint. Larger the score, larger the number of issues found at the endpoint. |
Sort and Filter Options:
- Clicking on any column header sorts the events based on the alphabetical order of entries in that column
The 'Filter' drop-down at the top left allows you to filter the scanning details based on discovery of assets at the IP addresses scanned. The available options are:
 |
|
Save Logs:
You can generate an XML file from
the currently displayed logs and save it for analysis at a later
time.
To save the logs
- Use the filter to view the scan details you want to save as XML file
- Click 'Export to XML' and save the generated .xml file on your computer