


View the Dashboard and Export Reports
Service Desk's powerful dashboard is the single pane of glass which allows you to easily monitor the status and progress of tickets in your account.
- The 'Admin' dashboard contains detailed statistics and charts about tickets for all clients.
- The 'Staff' dashboard shows similar information but only for clients assigned to the staff member.
- To view the Admin Dashboard, click the 'Dashboard tab' in the Admin Panel.
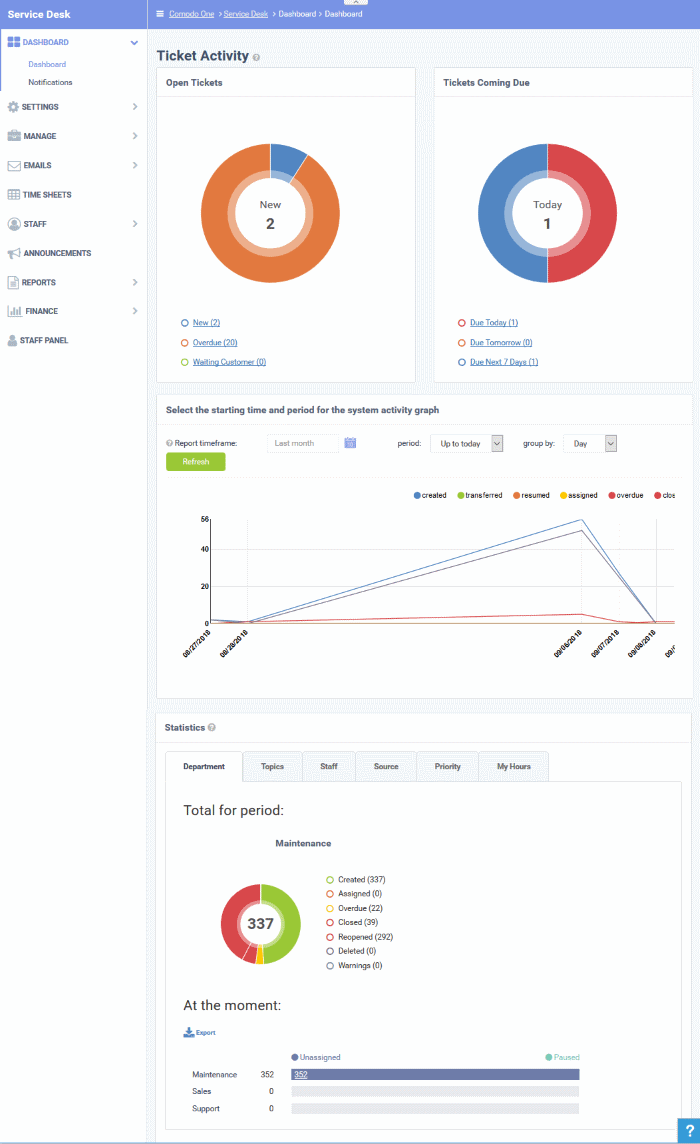
Ticket Activity
The upper pane of this section shows the total open tickets, a summary of pending tickets, and the number of tickets that are due shortly. The system activity graph shows daily, weekly and monthly ticket activity. The lower pane contains charts showing tickets by status, department, ticket category and more.
Open Tickets
The total number of unresolved tickets. The pie chart breaks this down into tickets that are yet to be attended (new), overdue and awaiting customer response.
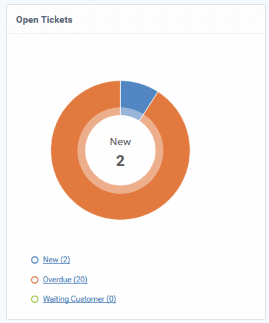
- Place your mouse on a sector to see the number of tickets in each category.
Ticket Coming Due
A heads up on tickets that are due in the near future:
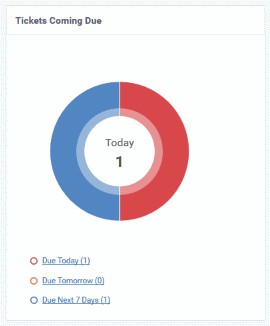
- Place your mouse on a sector to see the number of tickets in each category.
Ticket
Activity - History
Line chart which shows a break-down of ticket statuses in your customers over-time. For example, the chart shows how many tickets have a status of 'closed', 're-opened' or 'assigned' at various points in time. You can select which statuses are shown by clicking on the legend above the graph.
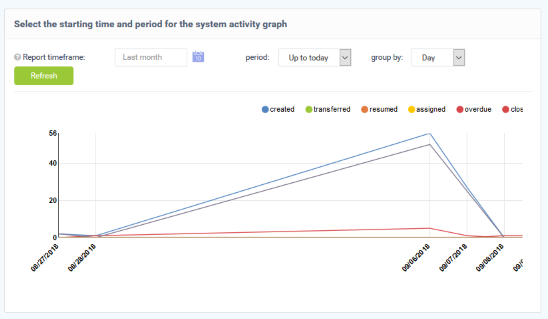
By default, the graph shows details for the previous 30 days. Use the 'Report timeframe' options to change the time-period. Click 'Refresh' to implement your changes.
Statistics
The statistics area shows details about for the full period since you started using Service Desk. You can view statistics based on 'Department', 'Ticket Category', 'Staff', 'Ticket Generation Source' and 'Priority'.
The 'At the moment' graph at the bottom shows the number of tickets that are unassigned and paused depending on the parameter selected. For example, if 'Source' is selected, the graph will display the number of tickets that are unassigned and paused for each ticket source type. Sources include 'Email', 'Phone' and 'Other'.
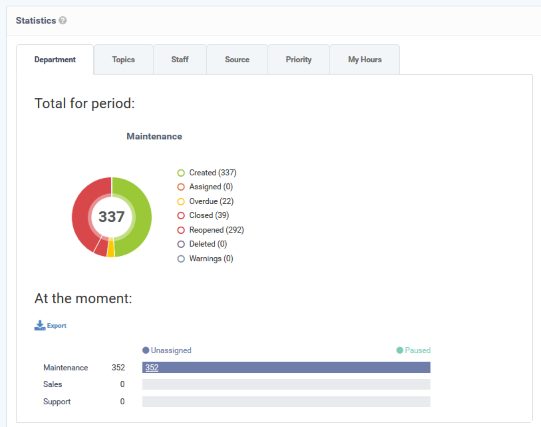
- 'Overdue' - tickets that have passed the grace period for a particular Service Level Agreement (SLA) plan.
- 'Warnings' - tickets that are configured to trigger warnings for a particular SLA plan.
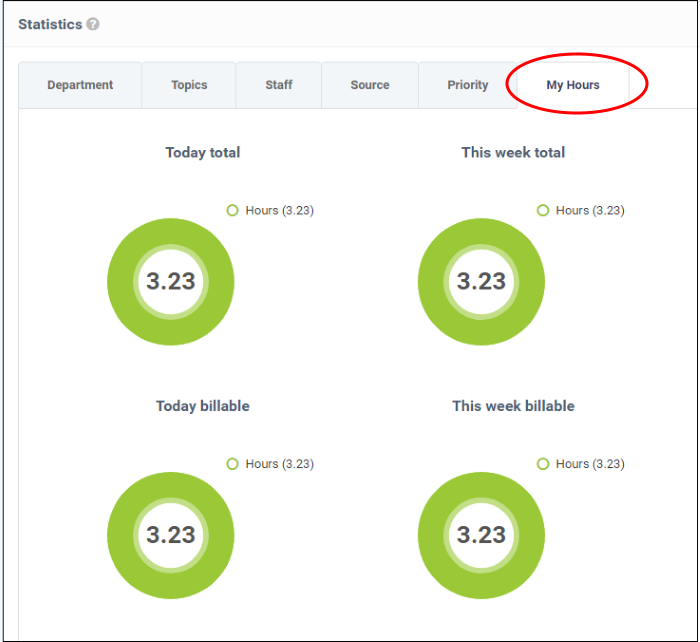
- The 'My Hours' tab shows stats on time spent on tickets by the currently logged-in administrator.
Exporting Statistics to a CSV file
Click the 'Export' button at the bottom of the interface to download the 'Statistics' file in CSV format. This file can be opened with applications such as Microsoft Excel or Open Office Calc. Please note this option is not available for 'My Hours' statistics.