ITarian Help

Find the desired product help

ITarian

ITarian

Quote Manager - Admin Guide

English

Print Help Download Help
Reports > View Revenue Statistics
  • Introduction To Quote Manager
    • Quick Start Guide
    • Login To Quote Manager
    • The Quote Manager Admin Console
  • The Home Screen
  • Manage Items
    • Add A New Item
    • Add Bulk Items
    • Edit An Item
    • Archive Out-Dated Items
  • Manage Customers
    • Add A New Customer
    • Edit A Customer
    • Archive A Customer
  • Manage Quotes
    • Generate A New Quote
    • Answer Feedback And Process Quotes
    • Set A Reminder
    • View Quote Activity
    • Archive A Quote
  • Manage Quote Templates
    • Create A New Quote Template
    • Remove A Quote Template
  • Settings
    • Personal Settings
    • My Company Settings
      • General Settings
      • Quote Appearance Settings
      • Quote Parity Settings
      • Quote Currencies Settings
      • Configure Email Templates
      • Configure Company Settings
      • Configure Tax Rates
    • Configure Integrations
  • Reports
    • Top Statistics
    • View Revenue Statistics
  • About ITarian

View Revenue Statistics


  • The 'Revenue Statistics' report displays bar-charts of monthly revenue compared to previous years.
  • Click 'Reports' from the left navigation, to view the top statistics report.
  • Click the 'REVENUE STATISTICS' tab from the top

An example is shown below.


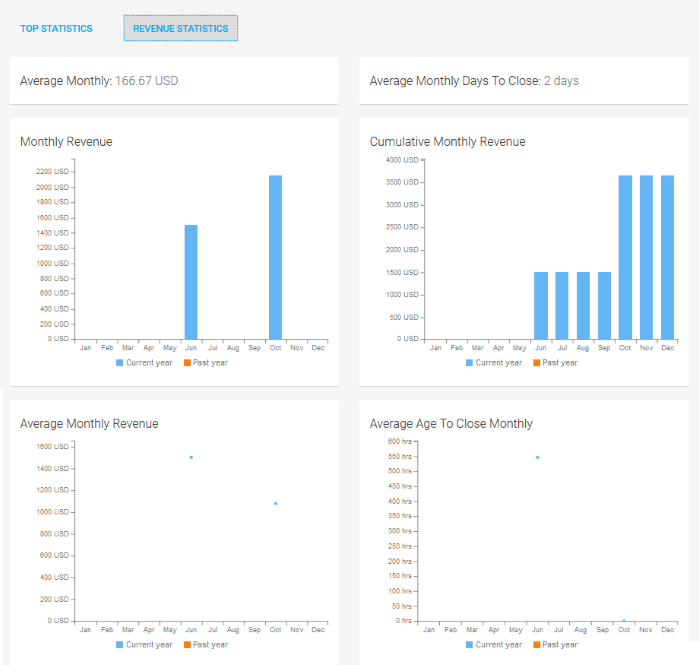
  • Average Monthly - Displays the average revenue generated per month for the current year
  • Average Monthly Days to close - Displays the average of life-cycle time of quotes dealt per month, for the current year

The report contains four charts:

  • Monthly Revenue - The bar-chart displays the income generated on each month of the current year and the previous year.
  • Cumulative Monthly Revenue - The bar-chart revenue generated on a cumulative basis for each month of the current year and the previous year.
  • Average Monthly Revenue - The graph displays the average monthly revenue calculated for each month of the current year and the previous year.
  • Average Age To Close Monthly - The graph displays the average of time taken for closing quotes dealt in each month of the current year and the previous year.
Comodo Help
  • IT Platform:
  • Help
  • Scripts
  • Wiki
  • Forum
  • Developer
  • RMM
  • Patch Management
  • Service Desk
  • ITSM
  • Managed Service Provider
  • Managed Detection and Response
  • Ticketing System
  • Helpdesk
  • ITIL

Copyright 2025 Itarian