


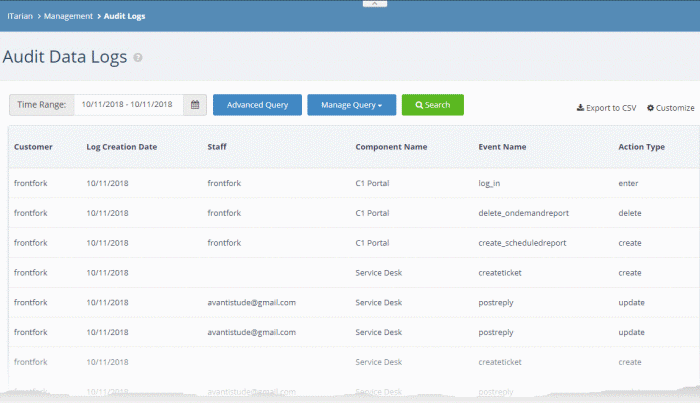
View Audit Logs
- Click 'Management' > 'Audit Logs'
ITarian stores event logs from the console and Service Desk for up to seven days
- The log viewer lets you view logs from both Service Desk and the ITarian console
- You can filter logs by module and event type
- You can run simple or complex queries to view specific logs. You can also save queries for repeat searches.
- Logs can be exported to a .csv file for later analysis
- You can customize which columns are shown in the interface.
View the Audit Logs
- Click 'Management' > 'Audit Logs'
|
Audit Data Logs - Table of Column Descriptions |
|
|---|---|
|
Column Header |
Description |
|
Customer |
The client company involved in the event. Note: The 'Customer' column is only available for ITarian MSP customers. |
|
Log Creation Date |
Time the log was generated. |
|
Staff |
Person who executed the action described in the log. |
|
Component Name |
The ITarian module responsible for the action. Possible values are:
|
|
Event Name |
The label assigned to the event. |
|
Action Type |
The activity performed in the event. |
|
The following columns can be added to the table by clicking the 'Customize' button at top-right. See 'Add/Remove Columns in the Log Viewer' for more details. |
|
|
Extra Information |
Additional details, if any, for the event. |
|
Old Value |
 |
|
Session ID |
The identifier of the admin/staff login session during which the event occurred. |
|
Affected Object |
The identifier of the parameter that was changed. |
|
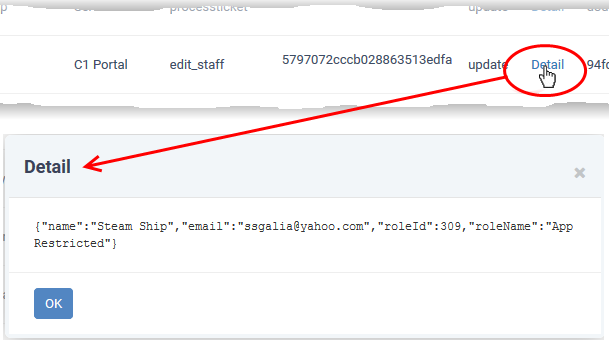
New Value |
Click the 'Detail' link to view the value of the parameter after the change. |
- You can navigate to different pages by clicking 'Next' or 'Prev' at the bottom.
Add/Remove Columns in the Log Viewer
Six columns are displayed by default in the 'Audit Data Log' interface. You can add more columns if you want to view additional details. You can also hide columns that you don't want displayed.
Add or remove columns
- Click the 'Customize' button at top-right
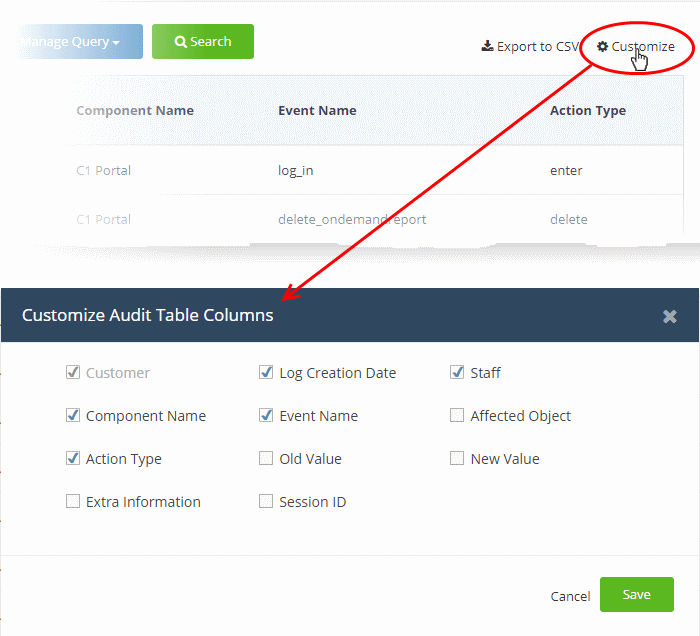
- Use the check-boxes to enable or disable columns as required
|
Note: Mandatory columns are grayed-out and cannot be disabled. |
- Click 'Save' to apply your changes
The following sections explain more about filtering and searching the logs
Select the Time Period to View
Logs
- Logs are available for up to seven days prior to the current date.
- Use the 'Time Range' field at top-left to choose the log display period.
View logs for a specific time period
- Click the calendar icon at the right of the 'Time Range' field
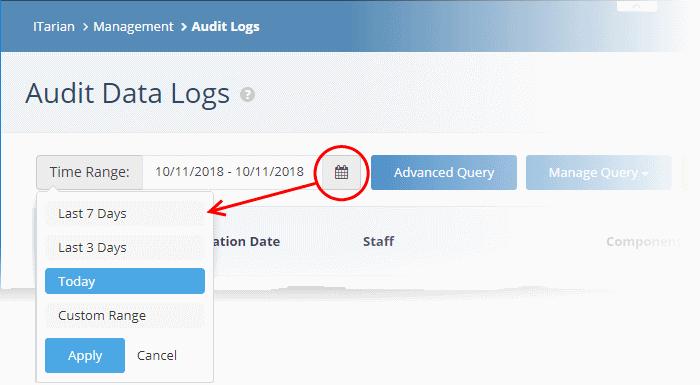
- Select the time period:
- Last 7 Days - Event logs for the previous seven days
- Last 3 Days - Event logs for the previous three days
- Today - Event logs for the current day
- Custom Range - Get event logs for a specific date range.
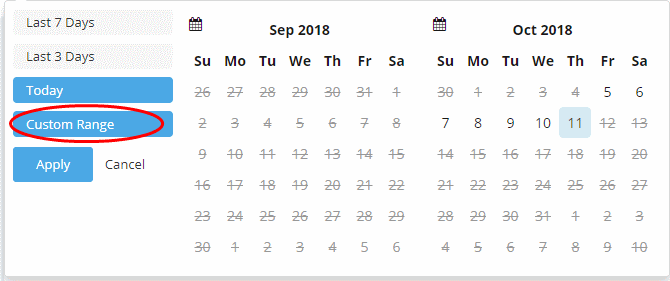
- Select the start and end dates from the calendars
- Click 'Apply'.
Use Advanced Search Query to Filter Logs
Custom search queries let you filter logs for specific events on a specific module. The query can also be saved for use in future use.
Filter logs using an advanced search query
- Click the 'Advanced Query' button on the top
The 'Advanced Query' dialog will open.
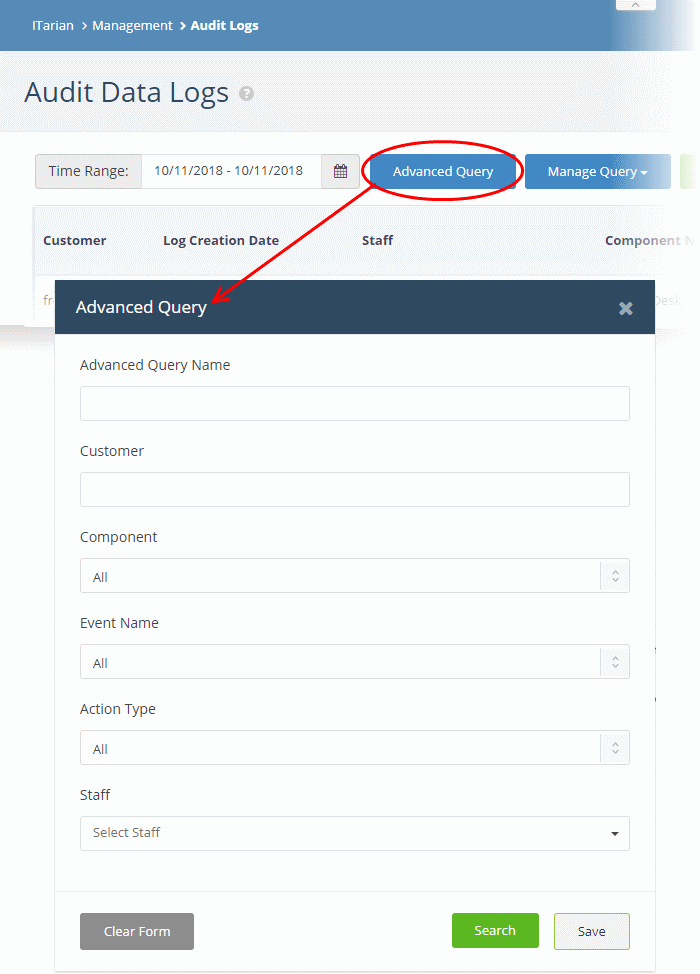
- Complete the form parameters:
|
Advanced Query - Form Parameters |
|
|---|---|
|
Column Header |
Description |
|
Advanced Query Name |
Create a label for the query. Ideally this should clearly identify the purpose of the query. |
|
Customer |
Search for logs which concern specific clients. |
|
Component |
Search for logs which concern specific ITarian modules. The available options are:
|
|
Event Name |
Search for logs that have a specific label. |
|
Action Type |
Search for logs which feature a specific activity. |
|
Staff |
Search for logs which involved specific personnel. |
- Click 'Search' to filter logs based on the conditions in your query
- Click 'Save' to save the query for future use. See Use Saved Search Queries to Filter Logs for more details
- To clear an active filter, click 'Advanced Query' > click 'Clear Form' > click 'Search'
Use Saved Search Queries to
Filter Logs
- ITarian
lets you save search queries for use in future
- Click the 'Manage Query' button at the top
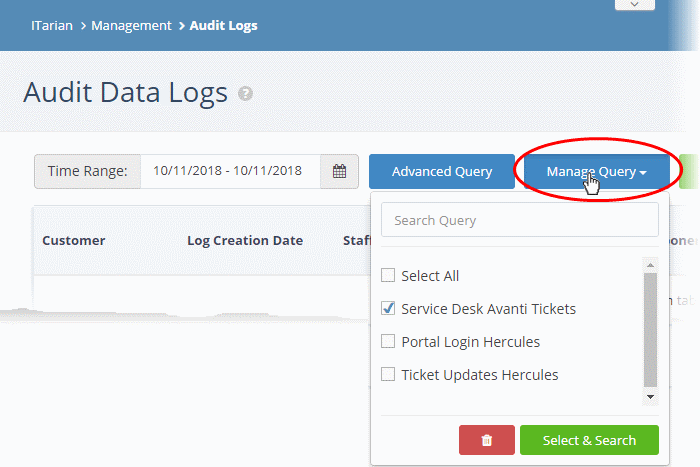
-
Select the queries you want to use from the drop-down. You can select any number of queries at a time.
|
Tip: Type first few letters of a query name in the 'Search' box to quickly find a specific query. |
- Click 'Select & Search'
The logs will be filtered and only those meeting the search queries will be displayed.
- Select queries and click the trash can icon
 to remove them from the list.
The currently displayed logs can be exported to a comma separated value (CSV) file for later analysis and troubleshooting.
To export logs to csv file:
- Click the 'Export to CSV' button
The log file will be downloaded as a .csv file. The file can be opened with spreadsheet applications like Microsoft Excel and OpenOffice Calc.