


The Dashboard
- Click the SOCaaP logo at top-left to open the dashboard.
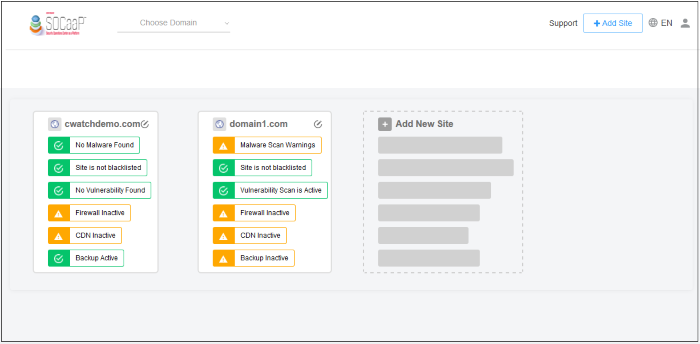
- The condensed view shows a security summary for each site on your account:
- Click a site tile to open its dedicated statistics and settings pages. Alternatively, select a site in the drop-down next to the SOCaaP logo.
Condensed view
- Each site on your account is shown as a separate tile.
- The rows on each tile tell you the security status of SOCaaP Web Protection component:

- Green - No threats found in the category
- Yellow - Requires action. For example, activate the firewall or run a malware scan.
- Red - Threats found in this category
- Click the
 at the top left corner of a tile to go to the domain overview page. See Website Overview for more details.
- Click a row to go to the respective configuration or results page.
Examples:
 - Opens the web application firewall settings page. See Configure WAF Policies for more details.
 - Opens the vulnerability scan results page. You can review the results and take further actions. See CMS Vulnerability Scans for more details.