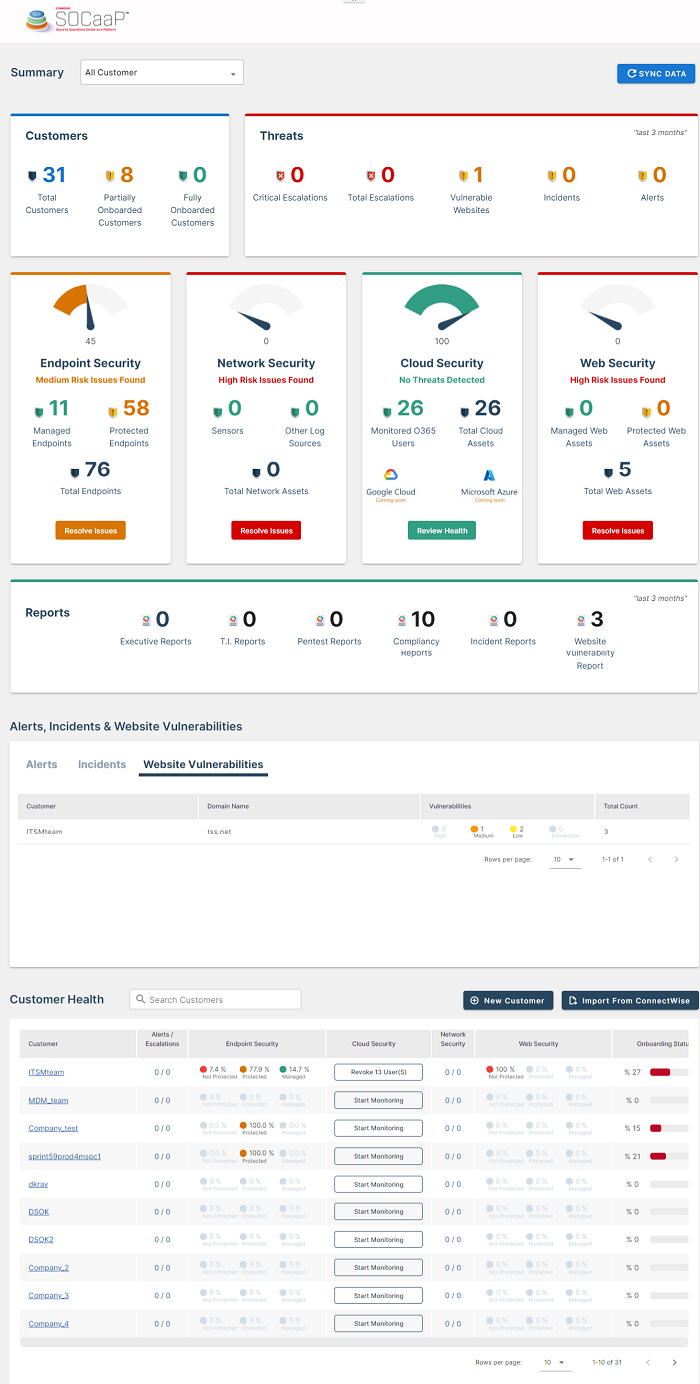
Dashboard Overview
The dashboard provides a snapshot of Summary, Alerts, Incidents, Vulnerability and Customer Health that were detected from customer networks for a selected period. The default view shows the details collected from all enrolled customers. This allows administrators to more effectively track customer progress, diagnose potential issues and to make informed decisions should corrective actions need to be taken. The administrator can filter the statistics for a specific customer by selecting the customer from the drop-down in the Summary section
The dashboard contains three tabs ‘Summary, ‘Alerts, Incidents and Vulnerabilities’ and Customer Health’
Use this link to jump over the specific topics.
The dashboard displayed by default when you click the SOCaaP Sensor. To switch to any other subtopics interface Go-To Applications > Select Alerts/Escalation, SIEM or Web Protection.
- Click 'Sync Data' the customers will be able to reach the up to date data on SOCaaP without the synchronization cycle.


