ITarian Help

Find the desired product help

SOCaaP

SOCaaP

Version 2.2

English

Print Help
SOCaaP Alerts/Escalations > Incidents Overview > Threat Summary
  • Introduction
    • Logging-in To The SOCaaP Console
  • Dashboard Overview
    • Summary
    • Alerts, Incidents And Website Vulnerabilities
    • Customer Health
  • SOCaaP Alerts/Escalations
    • Log-in To The Admin Console
    • The Home Screen
    • Service Summary
    • Incidents Overview
      • Incidents
      • Threat Summary
    • Log Collection Summary
    • Threat Communication Graph
    • Tickets
    • Reports
    • Notification Settings
    • Integrate Your Office 365 Account With SOCaaP
  • SOCaaP SIEM
    • Log-in To The Admin Console
    • The Main Interface
    • The Dashboard
    • Customer Asset Management
      • Add Customers
      • Add Assets For Monitoring
        • Hard Assets
        • Soft Assets
      • Configure Nxlog And Rsyslog To Send Logs To SOCaaP Server
      • Edit Customers
    • Query Management
      • Configure Event Queries
      • Long Term Analysis
      • Configure Custom Dashboards
      • Event Field Selection Settings
    • Manage Rules
      • Manage Correlation Rules
      • Manage Tagged Rules
      • Manage Aggregation Rules
    • Incidents
      • Manage Incidents
      • Incident Category Management
      • Category Action Management
    • Lists
      • Manage Live Lists
      • Manage Live List Content
      • Manage Range List Content
      • Manage IP Range List Content
      • Manage Multiple Column List Content
    • Manage Reports
    • Administration
      • Event Collection
      • Phantom Settings
      • Manage Users
    • Appendix 1 – Field Groups And Event Items Description
    • Appendix 2 – SOCaaP Supported Logs
  • SOCaaP Web Protection
    • Add Websites
    • The Main Interface
    • The Dashboard
    • Website Data And Settings
      • Website Overview
      • Security Scans
        • Website Scans
        • Website Files Security Scans
          • Malware Scan Settings
            • Automatic Configuration
            • Manual Configuration
          • Run A Scan And View Results
          • Notifications, Malware Removal And Scheduled Scans
        • Vulnerability Scans
          • CMS Vulnerability Scans
          • OWASP Top 10 Vulnerability Scans
      • Content Delivery Network
        • Activate CDN For A Website
        • CDN Settings
        • View CDN Metrics
      • Firewall
        • WAF Statistics
        • WAF Events
        • Configure WAF Policies
        • Manage Custom Firewall Rules
      • SSL Configuration
      • DNS Configuration
      • Add Trust Seal To Your Websites
      • Back Up Your Website
        • Backup Settings
        • On-Demand Backup
        • View Backup Records And File Statistics
        • Restore And Download Website Files
        • Delete Backups
    • Manage Your Profile
  • Sensor Installation
    • Requirements
    • (Option 1) Create Installation Media
    • (Option 2) Deploy Virtual Machine Environment
      • Create A New Virtual Machine
      • Configure Memory Size
      • Configure Hard Disk
      • View VM Summary
      • Configure Network Settings
      • Select VM Startup Disk
    • Sensor Installation Steps
    • Sensor Configuration Steps
      • Login To The Web Portal
      • User Settings
      • Configure Network
      • Configure Timezone
      • Key Activation
      • (Optional) Valkyrie Key Verdict
      • (Optional) Forward Log
  • Frequently Asked Questions
  • About ITarian Security Solutions

Threat Summary


The 'Threat Summary' dashboard shows attack sources, types of attack, attack origin and destination, and more.

  • Click 'Incidents Overview' > 'Threat Summary' to open the interface:
  • Select a customer at top-right


  • Statistics are shown for the past seven days by default.
  • Click the date range above the chart to change the time-period shown:


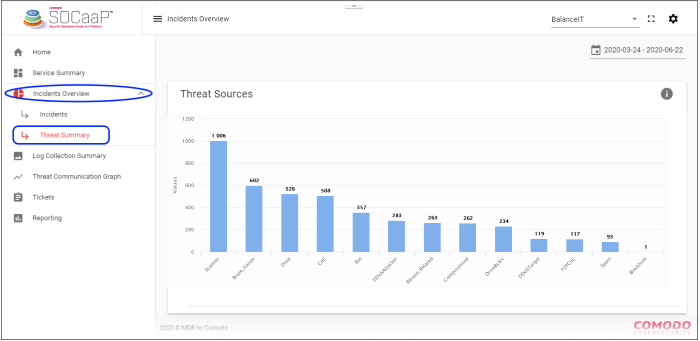
Threat Sources


Shows the types of threats that occurred over the selected time-period, and the number of sources for each:


  • X-axis – The name of the threat
  • Y-axis – Number of sources for each threat category
  • Click a bar graph to view its details:


Threat Distribution Map

  • A heat map of the threat sources


  • Click a country to view details of the threat categories from that country:


Top 10 Countries


'Top 10 Countries' shows the details of countries from where both incoming and outgoing threats were recorded. The details are shown by percentage.


  • Placing the mouse cursor over a segment will display further details.


  • Click a country legend below to enable/ disable its data. For example, click 'China' and this segment will be removed from the pie chart. Click the legend again to view it.


Top 10 Threat Types


This pie-chart shows the details of top ten-most incoming and outgoing threat types that were recorded.


  • Placing the mouse cursor over a segment will display further details.


  • Click a threat name below to enable/ disable its data. For example, click 'Scanner' and this segment will be removed from the pie chart. Click the legend again to view it.

Top 10 Internal IPs


This pie chart shows the details of endpoints from which the threat types originated. The number beside an IP indicates the threat counts that originated from the endpoint.


  • Placing the mouse cursor over a segment will display further details.


  • Click an IP to enable/ disable its data. For example, click '192.168.10.222' and this segment will be removed from the pie chart. Click the IP again to view it.
Comodo Help
  • IT Platform:
  • Help
  • Scripts
  • Wiki
  • Forum
  • Developer
  • RMM
  • Patch Management
  • Service Desk
  • ITSM
  • Managed Service Provider
  • Managed Detection and Response
  • Ticketing System
  • Helpdesk
  • ITIL

Copyright 2025 Itarian