


The Home Console
The home page is shown by default after you log in. The statistics and charts on this page can be customized by adding different widgets.
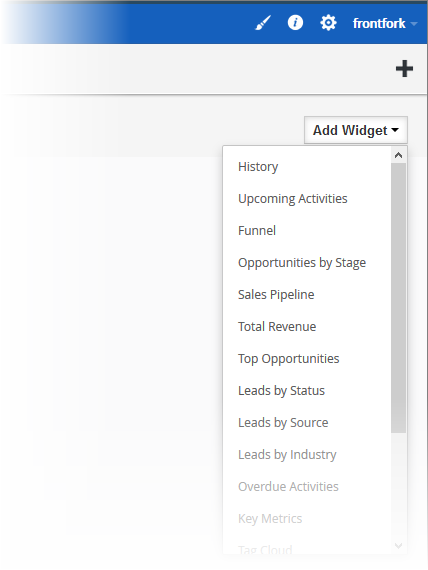
- Widgets are tiles containing key performance indicators which you can add to the home screen.
- Click the 'Add Widget' button on the home page to get started
- Choose
a widget from the list. The chosen tile will appear on the home
screen:
- Click the 'Refresh' icon at the top-right of a widget to load the latest information
- Click 'X' at the top-right of a widget to remove it.
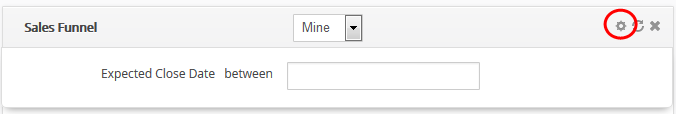
- Click the cog icon on a widget to filter which data is shown.
- History – A real-time feed of user actions performed on records in modules. The 'History' widget cannot be deleted.
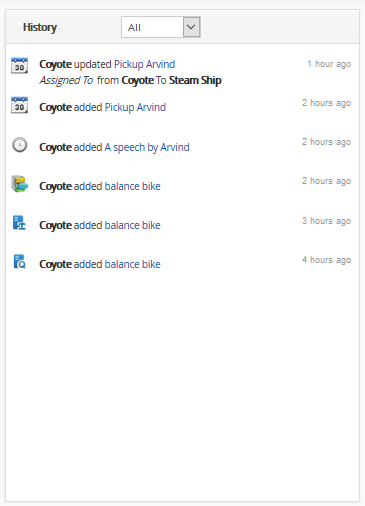
- Admins can see a complete history of changes across all records. Non-admins can only see their own changes.
- The drop-down about the list lets you switch between a history of actions and a history of comments.
- Funnel - Shows the number of opportunities you have in each stage of your sales cycle.
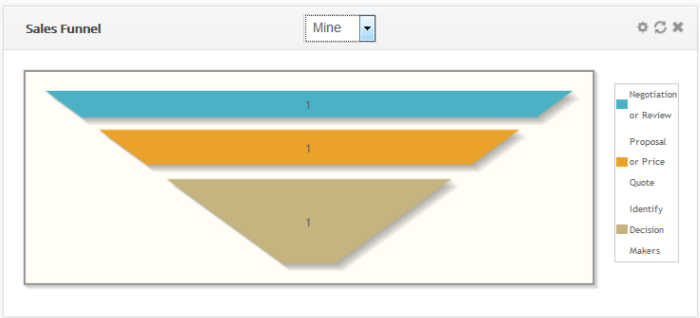
Use the drop-down above the chart to view the funnels of individual users, groups or the entire company.
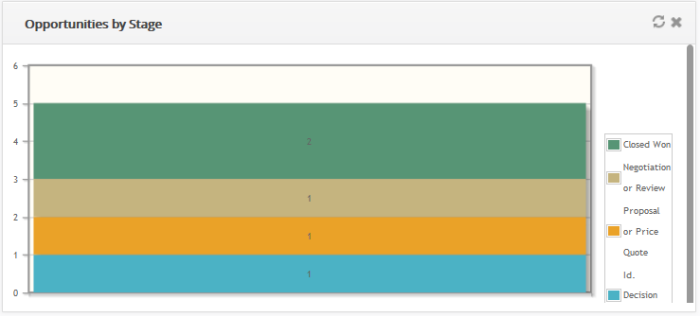
- Opportunities by Stage - Shows all current opportunities by sales stage.
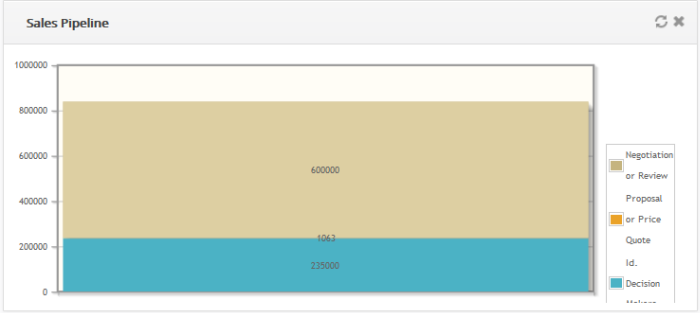
- Sales Pipeline – Shows the amount of potential revenue tied up in each stage of your sales cycle.
- Revenue by Salesperson – Shows revenues generated by different sales representatives on your team
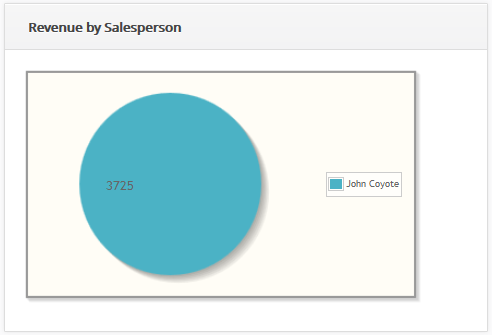
You can search for revenue by specific salespersons by clicking the cog icon at the top of the widget.
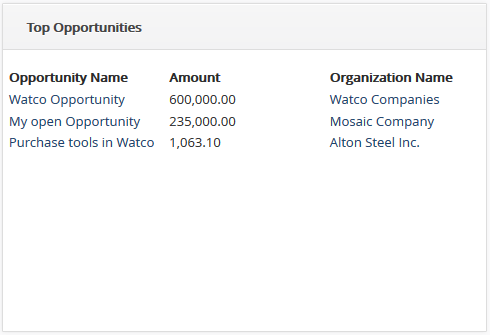
- Top Opportunities - Shows open leads with the highest projected revenues
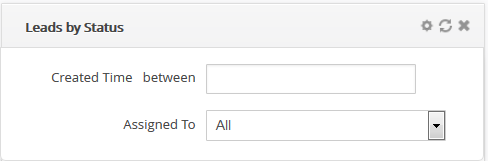
- Leads by Status - Shows the status of open leads and how many are in each status.
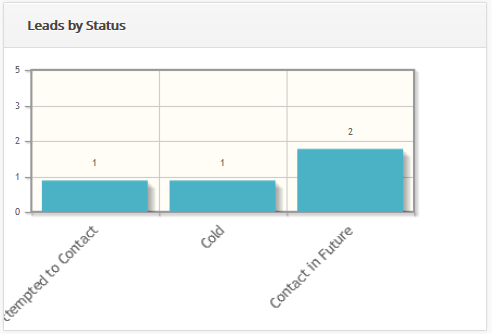
Click the cog icon to filter leads by creation date and/or by salesperson.
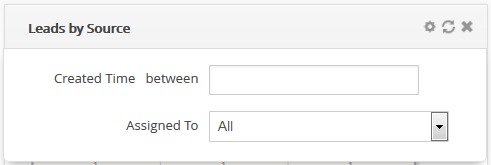
- Leads by Source - Shows the channels through which your leads were generated. The number of leads created by a particular channel is shown above its bar
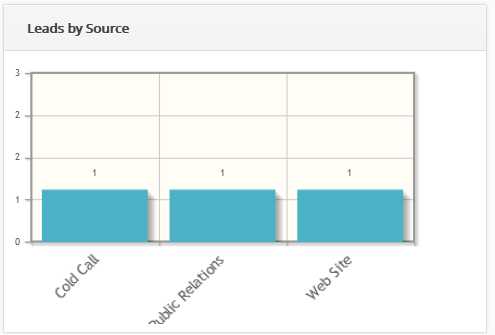
Click the cog icon to filter leads by creation date and/or by salesperson.
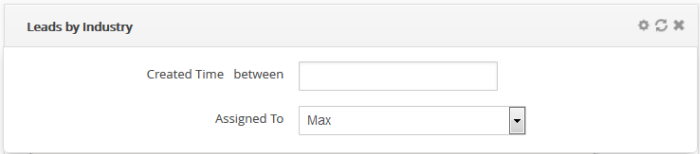
- Leads by Industry - Shows leads by the industry vertical to which they belong.
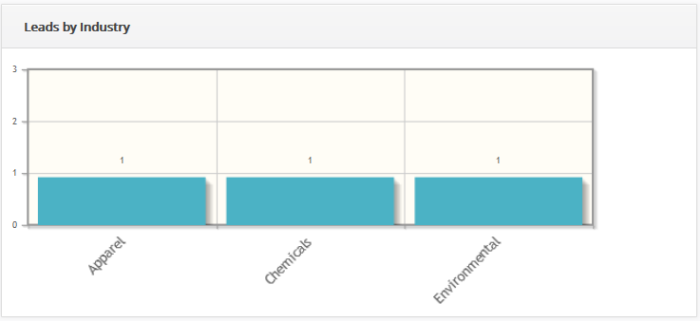
Click the cog icon to filter leads by creation date and/or by salesperson.
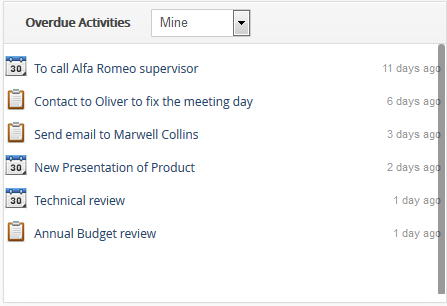
- Overdue
Activities - A list of events which were not completed by the deadline set for the task.
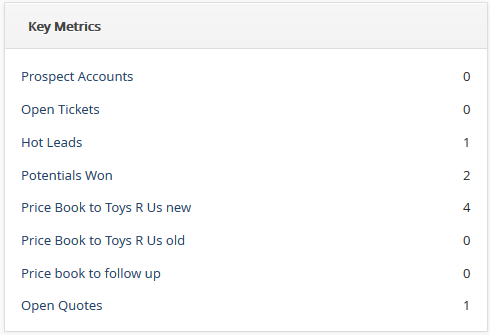
- Key
Metrics - A top-level list of important statistics about your sales operations.
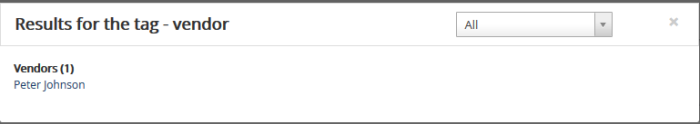
- Tag
Cloud – The list of all tagged records. You can tag a record from any of the CRM interfaces and it will be displayed in the 'Tag cloud' tile in the home page.
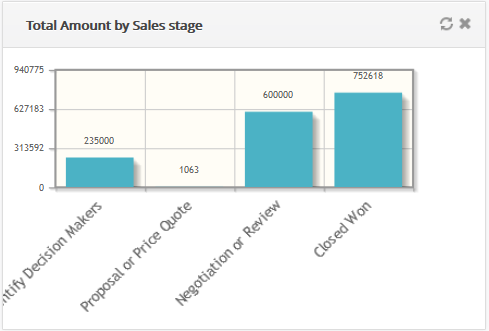
- Total
Amount by Sales stage - Shows a bar chart of opportunities according to their sales stages.
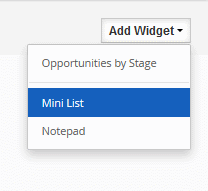
- Mini
List – Allows you to display summary data from CRM modules.
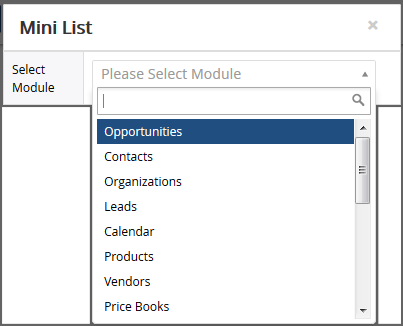
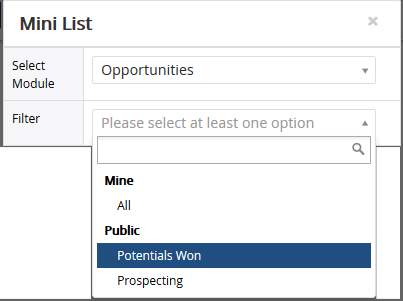
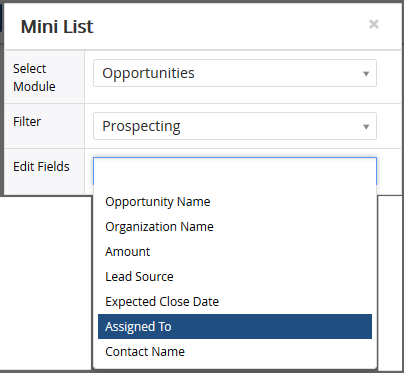
- To add a mini list, click 'Add Widget' button and then click 'Mini List' from the drop down menu.
- In the pop-up, select a desired Module, Filter, and select fields (Max 2) that you want to see records from
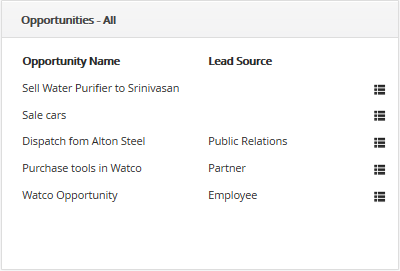
- Click
'Save' to apply the filter
The information of records in the filter will now be displayed in home page.
- Notepad - Allows you to write and save quick notes on the home page.
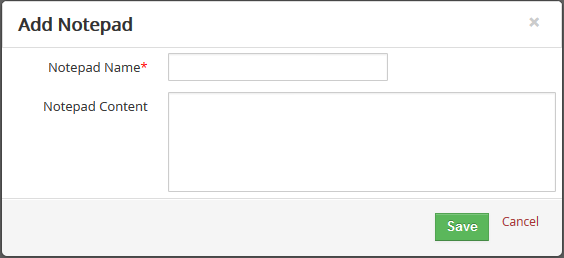
- Enter notepad name and notepad content details and then click 'Save'.
The note will be displayed on the home interface.
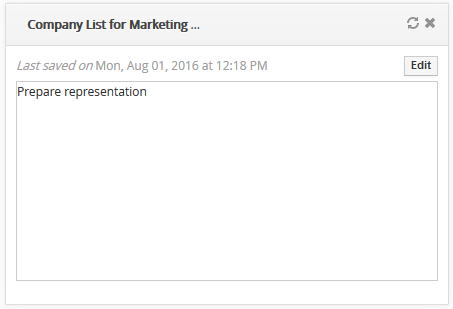
- Click the 'Edit' button at top-right to edit the note
Each module has a dashboard area accessible from the left side of the module interface.
The
'Quick Create' menu on the right ('+' icon) allows you to quickly add
new 'Campaigns', 'Organizations', 'Products', 'Vendors',
'Leads', 'Opportunities', 'Services', 'Events', 'Contacts', 'Assets'
and 'Price Books'. See Quick
Create to create these records in short period.