Monitors for Windows Devices
- Click 'Configuration Templates' > 'Monitors'
- Click 'Create Monitors'
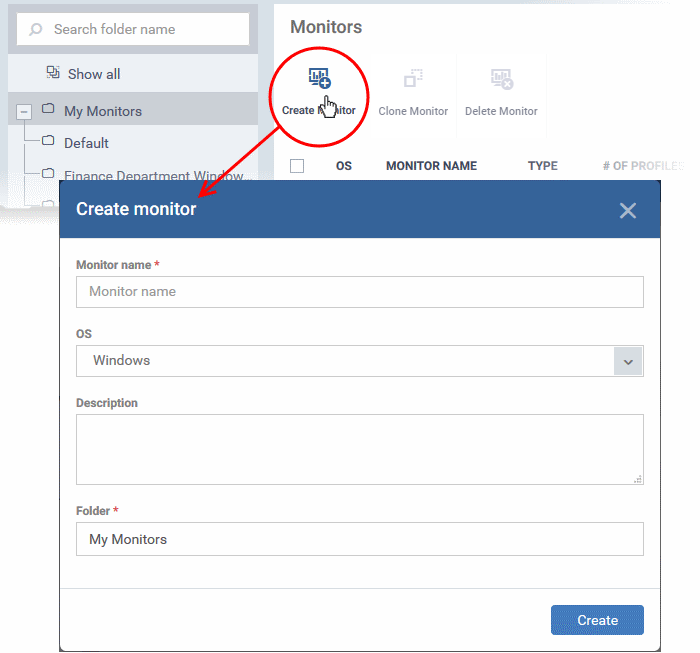
- Enter a label and description for the monitor.
- Select 'Windows' in the OS drop-down.
- Specify where to save the new monitor. You can create new sub-folders under 'My Monitors' if required.
- Click 'Create' to open the monitor configuration screen:
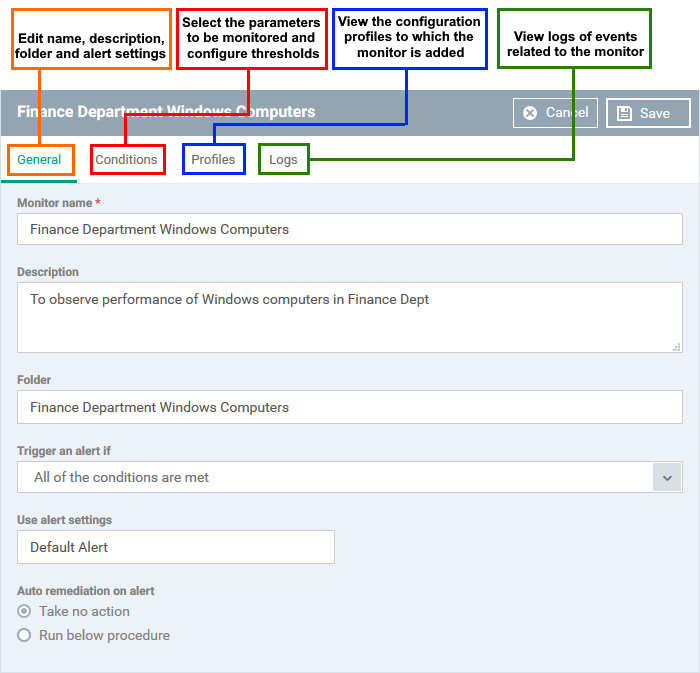
Modify
the following settings if required:
- Trigger an alert if - Select when the alert should be sent to admins. The options are sent alert when all conditions are met or when any condition is met.
- Use Alert Settings - Choose the alert template you want to use if the conditions of this monitor are met.
- Alert templates are collections of settings which govern alert recipients and additional options.
- For example, you can create a Service Desk ticket from the alert and choose whether or not you want to see the alert in the portal.
- You can create different alert templates for different situations.
- Click ‘Configuration Templates’ > ‘Alerts’ to view and manage alert templates. Make sure the alert is active to receive notifications. See 'Manage Alerts' for more details.
- Auto Remediation on alert - Choose how you want to respond to the alert:
Click 'Save'.
- Taken no action - No automatic response is made to the alert. You can, of course, manually run a procedure in response to the alert.
- Run below procedure - Select a procedure to run on affected endpoints in response to the alert. The procedures listed here are defined in the Procedures interface. Type the first few characters of the procedure and select from the list.
- Click the 'Conditions' tab followed by 'Edit' to define monitor thresholds
- Click 'Add Condition'.
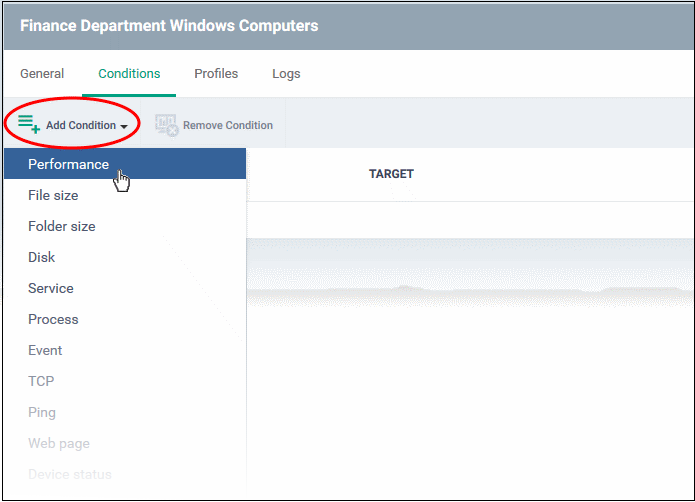
- Select 'Performance' Choose the parameter you want to monitor
.png)
Performance:
- CPU usage: If you set a condition for CPU usage the system will trigger an alert when the CPU usage exceeds 75% of its usage.
- RAM usage: By default, the system will send you an alert when the RAM usage exceeds 80%.
- Network usage: A network usage trigger alert when the usage exceeds 90%.
- Disk utilization - Triggers an alert if free disk space in any of the system drive or other drive partitions falls below a certain level, or if there are large alterations to disk space in a short time.
|
Condition Type |
Condition Setting |
Note |
|
CPU usage |
More than 75% for 30 min |
Alter existing |
|
RAM usage |
More than 80% for 30 min |
Alter existing |
|
Network |
More than 90% for 30 min |
Alter existing |
|
Disk Utilization |
More than or equal to 99% for 30 min |
New |
|
Available Monitors |
|
|---|---|
|
Performance |
Checks CPU, RAM and network usage and triggers an alert if certain conditions are met. |
|
File Size |
Checks the disk space used by a specific file. Triggers an alert if the file size is less or more than a specific size. |
|
Folder Size |
Checks the disk space used by a directory. Triggers an alert if the folder size is less or more than a specific size. |
|
Disk |
Checks free disk space, or for large changes to free disk space in short periods. Trigger an alert if disk space falls below a certain level, or if there are large alterations to disk space in a short time period. |
|
Service |
Checks whether or not a named service is running. Triggers an alert if the condition is met. |
|
Process |
Checks whether or not a named process is running. Triggers an alert if the condition is met. |
|
Event |
Checks if a specific event occurs and alerts you accordingly. The condition monitors Windows event logs. You must specify the event ID, the criticality of the event, and the source of the event. |
|
TCP |
Checks whether a specific port is open or closed and alerts you accordingly. This is useful for important ports that need to remain open/closed for operational reasons. You need to specify the host name/ IP of the target port, the port number, the polling interval (in seconds), and whether you want to test for an open or closed state. |
|
Ping |
Checks whether a host is online or not. You need to specify the host name, the polling interval (in seconds), and whether you want to test for an online or offline status. |
|
Web Page |
Checks whether specific content is present or not present on a webpage. You need to specify the URL, the content you want to search for, the polling interval (in minutes), and the present/not present status. You are alerted if the condition is met. |
|
Device Status |
Checks every managed
device to see whether it has been online or offline for a certain
length of time. You will receive an alert if the device has been
offline/online for the length of time you specify. Background. Every minute, managed devices send a message to Endpoint Manager to signal they are online. If EM does not receive this signal for three minutes straight then the device status is set to ‘Offline’. This condition will alert you if a device has been continuously ‘Offline’ (or ‘Online’) for the total length of time you specify. |
|
Custom Script |
Create a python script to monitor for your own set of conditions. Paste your script in the space provided. See Add Custom Monitoring Conditions if you need help with this. |
|
Security Events |
Checks for significant security related events on the managed endpoint. Example events monitored are:
You can receive an alert when the condition is met, or automatically run a procedure. |
|
Security Client Events |
Alerts you when there are errors with Comodo Client Security (CCS). CCS is the endpoint application which provides the antivirus, firewall and containment services. This monitor checks for any failure in those processes, including:
You can receive an alert when the condition is met, or automatically run a procedure. |
|
OS Patches Event |
Alerts you on events when various types of Windows patches are installed. You can monitor the installation of:
|
| Disk Utilization | Checks disk utilization performance. Triggers an alert if the performance matches the defined parameters. |
| Free space left on any disk | Checks disk space available in any disk. Triggers an alert if the available free disk space matches the defined parameters. |
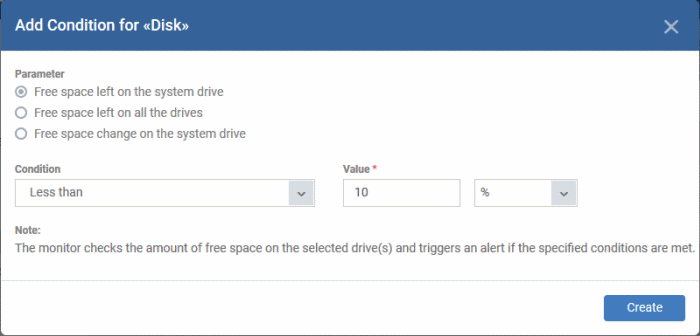
- Define
the specifics of the condition. The type of information you need to
provide depends on the condition. For example, if you select 'Disk'
monitor, you have the option to specify conditions for three values.
See the example image below.
- Repeat the process to add more parameters and monitoring conditions.
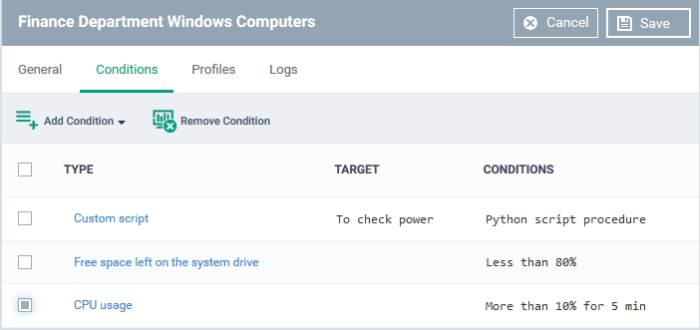
- To remove a monitoring condition, select the check box beside it and click 'Remove Condition' at the top.
- Click 'Save' to apply your changes.
Add Custom Monitoring
Conditions
- Endpoint Manager allows you to create custom monitoring conditions per your business requirements.
- You can create custom scripts in python and can define which items should be monitored. You can also define the threshold before an alert is generated.
- You can use custom script with parameters when creating a monitor
- Predefined script monitors are available in 'Configuration Templates' > 'Procedures' > 'Predefined Procedures' > 'Monitors'. These are available for selection in the 'Add Existing Procedure' >'Procedure name' drop-down.
Add a custom script to the monitoring conditions
- Choose 'Custom script' from the 'Add Condition' drop-down
The 'Add Condition for Custom Script' form will appear.
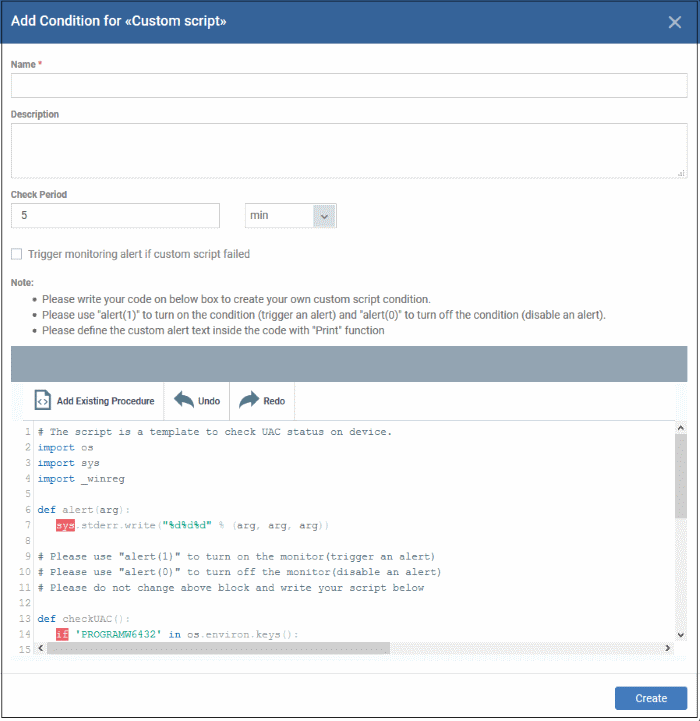
|
Add Condition for Custom Script - Table of Parameters |
|
|---|---|
|
Form Element |
Description |
|
Name |
Enter a label for the script, shortly describing its purpose. |
|
Description |
Enter a short description for the script. |
|
Check Period |
Enter the time interval at which the script
should be run on the endpoints to which the profile is applied. Tip: Ensure that the check period is greater than the time taken for the script to run and complete, so that successive executions of the script do not overlap. |
| Trigger monitoring alert if custom script failed | Select this if you want to generate a warning notice if the custom script did not run successfully. |
|
Script |
Enter your Python script in the text editor. Note 1: Keep the following lines intact in the editor and enter your script below these:
Note 2: If you want an alert to be triggered if the condition is met set the argument to alert parameter to 1, i.e. 'alert(1)'. If you do not want an alert to be triggered even if the condition is met set the argument to alert parameter to 0, i.e. 'alert(0)'. Note 3: You can import an existing script procedure in EM if you wish to create a new custom monitor script using an existing procedure as a starting point. To do so, click 'Add Existing Procedure' and choose the existing procedure. Edit the script as per your requirement as per Note 1. For more details on procedures, see Manage Procedures. Note 4: In addition to the above, Python script monitors by the Comodo development team are available in the 'Monitors' folder under 'Configuration Templates' > 'Procedures' > 'Predefined Procedures'. You can add these predefined scripts by clicking 'Add Existing Procedure' and select from the 'Procedure name' drop-down and can be used directly without any changes. Feel free to try any script that fits your needs. If you require custom scripts from Comodo, please raise a request at https://c1forum.comodo.com/forum/script-library/4460-script-requests-comodo-will-write-the-scripts-for-you-for-free Note 5: You can add parameters to your custom scripts. Click here to know how. |
- Complete the form and click 'Create'
The custom monitor will be added to the list of monitors under the 'Monitors' tab.
Add parameters to custom scripts
You can add parameter types such as integer, list, unicode and float to your custom script in the monitor condition form.
- Click 'Configuration Templates' > 'Monitors'
- Click 'Create Monitors'
- Complete the form as explained above
- Click 'Add Condition' and select 'Custom script'
- See 'Add Custom Monitoring Conditions' explained above
- Scroll down to the script area and enter the following code:
name=itsm.getParameter('parameterName')
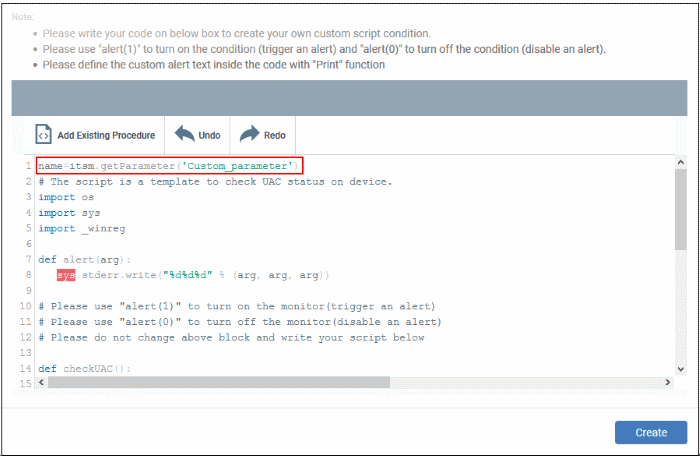
- Click 'Create'
Custom script parameters dialog box appears:
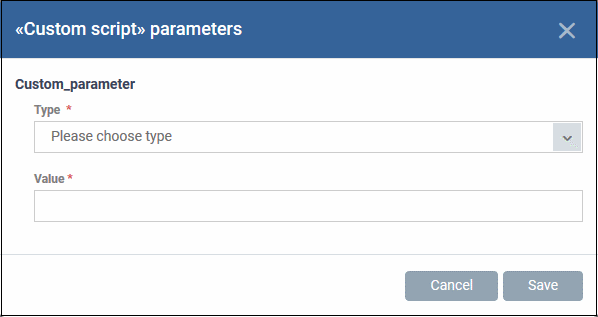
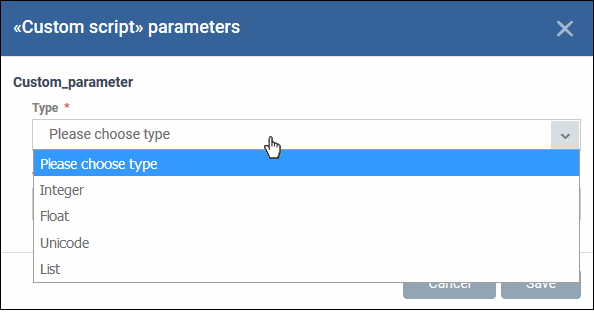
- Type – Select the parameter type from the drop-down. Available types are:
- Integer
- Float
- Unicode
- List
- Value - Enter appropriate parameter value
- Click 'Save'.
The monitor will be available for selection under 'Add Monitor' when configuring the 'Monitors' section of a Windows profile. For more details on adding a monitor to a profile, see Monitor Settings in Create Windows Profiles.


