ITarian Help

Find the desired product help

IT Endpoint Manager

IT Endpoint Manager

Endpoint Manager Administrator Guide 6.43

English

Print Help Download Help
Devices And Device Groups > Manage Devices > Manage Mac OS Devices > View Mac Device Logs
  • Introduction To Endpoint Manager
    • Key Concepts
    • Best Practices
    • Quick Start
    • Sign Up For An ITarian Account
    • Login Into The Admin Console
  • The Admin Console
  • The Dashboard
  • Devices And Device Groups
    • Manage Device Groups
      • Create Device Groups
      • Edit A Device Group
      • Assign Configuration Profiles To A Device Group
      • Remove A Device Group
      • Run Procedures On Customer Groups
    • Manage Devices
      • Add New Devices
      • Manage Windows Devices
        • View And Edit Device Name
        • View Summary Information
        • View Hardware Information
        • View Network Information
        • View Maintenance Windows Associated With Device
        • View And Manage Profiles Associated With A Device
        • View And Manage Applications Installed On A Device
        • View The Files On A Device
        • View Exported Configurations And Import Profiles
        • View MSI Files Installed On A Device Through Endpoint Manager
        • View And Manage Patches For Windows And 3rd Party Applications
        • View Antivirus Scan History
        • View And Manage Device Group Memberships
        • View Device Logs
      • Manage Mac OS Devices
        • View And Edit Mac OS Device Name
        • Summary Information Of Mac Device
        • View Installed Applications
        • View Quarantined Files
        • View And Manage Profiles Associated With A Device
        • View Mac OS Packages Installed On A Device Through Endpoint Manager
        • View And Manage Device Group Memberships
        • View Mac Device Logs
      • Manage Linux Devices
        • View And Edit Linux Device Name
        • Summary Information Of Linux Device
        • View Network Information Of A Linux Device
        • View And Manage Profiles Associated With A Linux Device
        • View Linux Packages Installed On A Device Through Endpoint Manager
        • View And Manage Device Group Memberships
      • Manage Android Devices
        • View And Edit Device Name
        • View Summary Information
        • Manage Installed Applications
        • View And Manage Profiles Associated With A Device
        • View Sneak Peek Pictures To Locate Lost Devices
        • View The Location Of The Device
        • View And Manage Device Group Memberships
      • Manage IOS Devices
        • View Summary Information Of An IOS Device
        • View And Edit Device Name Of An IOS Device
        • View Applications Installed On An IOS Device
        • View And Manage Profiles Associated With An IOS Device
        • View The Location Of An IOS Device
        • View And Manage Group Memberships Of An IOS Device
      • View User Information
      • Remove A Device
      • Remote Management Of Windows And Mac OS Devices
        • Transfer Items To / From The Remote Computer
      • Remotely Manage Folders And Files On Windows Devices
      • Manage Processes On Remote Windows Devices
      • Manage Services On Remote Windows Devices
      • Use The Command Prompt On Remote Windows Devices
      • Apply Procedures To Windows And Mac Devices
      • Remotely Install And Manage Packages On Windows Devices
      • Remotely Install Packages On Mac OS Devices
      • Remotely Install Packages On Linux Devices
      • Send Enrollment Link To IOS Devices
      • Install Apps On Android/iOS Devices
      • Generate An Alarm On Android Devices
      • Remotely Lock Mobile And Mac OS Devices
      • Wipe Selected Mobile And Mac Devices
      • Assign Configuration Profiles To Selected Devices
      • Set / Reset Screen Lock Password For Mobile Devices
      • Update Device Information
      • Send Text Messages To Mobile Devices
      • Restart Selected Windows Devices
      • Shutdown Windows Devices
      • Wake Offline Device
      • Change A Devices Owner
      • Change The Ownership Status Of A Device
      • Add Custom Notes And Tags On Devices
      • Generate Device List Report
    • Bulk Enrollment Of Devices
      • Enroll Windows, Mac OS And Linux Devices By Installing The Communication Client
        • Enroll Windows Devices Via AD Group Policy
        • Enroll Windows, Mac OS And Linux Devices By Offline Installation Of Agent
        • Enroll Windows Devices Using Auto Discovery And Deployment Tool
      • Enroll The Android And IOS Devices Of AD Users
    • Download And Install The Remote Control Tool
  • Users And User Groups
    • Manage Users
      • Create New User Accounts
        • Manually Add Users
        • Import Users From A CSV File
      • Enroll User Devices For Management
        • Enroll Android Devices
        • Enroll IOS Devices
        • Enroll Windows Endpoints
        • Enroll Mac OS Endpoints
        • Enroll Linux OS Endpoints
      • View User Details
        • Update The Details Of A User
      • Assign Configuration Profiles To User Devices
      • Remove A User
      • Generate New Password For A User
      • Reset Two Factor Authentication Token For A User
      • Run Procedures On User Devices
    • Manage User Groups
      • Create A New User Group
      • Edit A User Group
      • Assign Configuration Profiles To A User Group
      • Remove A User Group
      • Run Procedures On Group Devices
    • Configure Role Based Access Control For Users
      • Create A New Role
      • Manage Permissions And Users Assigned To A Role
      • Remove A Role
      • Manage Roles Assigned To A User
  • Configuration Templates
    • Create Configuration Profiles
      • Profiles For Android Devices
      • Profiles For IOS Devices
      • Profiles For Windows Devices
        • Create Windows Profiles
          • Associated Devices Settings
          • Remote Control Settings
          • Client Access Control
          • Client Proxy Settings
          • Communication Client Update Settings
          • Client UI Settings
          • Remote Tools Settings
          • Monitors
          • Procedure Settings
          • Patch Management Settings
          • Maintenance Window Settings
          • Global Proxy Settings
          • Communication Client Rebranding
          • Client Logging Settings
          • Antivirus Settings
          • Firewall Settings
          • HIPS Settings
          • File Rating Settings
          • Containment Settings
          • VirusScope Settings
          • Xcitium Verdict Cloud
          • Agent Discovery Settings
          • External Devices Control Settings
          • Miscellaneous Settings
          • Script Analysis Settings
          • Data Loss Prevention Settings
          • Xcitium Client Security Access Control
          • XCS Updates
          • Xcitium Client Security UI Settings
          • XCS Logging Settings
          • Thumbnails Settings
          • Performance Settings
          • Chat Settings
        • Import Windows Profiles
      • Profiles For Mac OS Devices
        • Create A Mac OS Profile
          • Antivirus Settings For Mac OS Profile
          • Certificate Settings For Mac OS Profile
          • Restrictions Settings For Mac OS Profile
          • VPN Settings For Mac OS Profile
          • Wi-Fi Settings For Mac OS Profile
          • Remote Control Settings For Mac OS Profile
          • External Device Control Settings For Mac OS Profile
          • Valkyrie Settings For MacOS Profile
          • Procedure Settings For Mac Profiles
          • Monitor Settings For Mac OS Profile
      • Profiles For Linux Devices
        • Create A Linux Profile
          • Antivirus Settings For Linux Profile
          • Communication Client And Comodo Client - Security Application Update Settings For Linux Profile
          • User Interface Settings For Linux Profile
          • Logging Settings For Linux Profile
          • Clients Access Control Settings For Linux Profile
          • Valkyrie Settings For Linux Profile
    • View And Manage Profiles
      • Export And Import Configuration Profiles
      • Clone A Profile
    • Edit Configuration Profiles
    • Manage Default Profiles
    • Manage Alerts
      • Create A New Alert
      • Edit / Delete An Alert
    • Manage Procedures
      • View And Manage Procedures
      • Create A Custom Procedure
      • Combine Procedures To Build Broader Procedures
      • Review / Approve / Decline New Procedures
      • Add A Procedure To A Profile / Procedure Schedules
      • Import / Export / Clone Procedures
      • Change Alert Settings
      • Apply Procedures To Devices
      • Edit / Delete Procedures
      • View Procedure Results
    • Manage Monitors
      • Create Monitors And Add Them To Profiles
        • Monitors For Windows Devices
        • Monitors For Mac OS Devices
      • View And Edit Monitors
    • Data Loss Prevention Rules
      • Create DLP Discovery Rules And Add Them To Profiles
      • View And Edit DLP Discovery Rules
      • Create DLP Monitoring Rules And Add Them To Profiles
      • View And Edit DLP Monitoring Rules
  • Security Systems
    • Security Dashboards
      • View Security Events By Time
      • View Security Events By Files
      • View Security Events By Device
    • View Contained Applications
    • Manage File Trust Ratings On Windows Devices
      • File Ratings Explained
    • View List Of Valkyrie Analyzed Files
    • Antivirus And File Rating Scans
      • Run Antivirus And/or File Rating Scans On Devices
      • Handle Malware On Scanned Devices
      • Update Virus Signature Database On Windows, Mac OS And Linux Devices
    • View And Manage Identified Malware
    • View And Manage Quarantined Items
    • View Android Threat History
    • View And Manage Autorun Items
    • View History Of External Device Connection Attempts
    • Data Loss Prevention Scans
      • DLP Logs
      • DLP Quarantined Files
  • Network Management
    • Create And Run Network Discovery Tasks
    • Manage Profiles For Network SNMP Devices
    • Manage Network Devices
      • Manage SNMP Devices
        • SNMP Device Details Interface
      • Discovered Devices
    • Manage Network Monitors
  • Application Store
    • IOS Apps
      • Add IOS Apps And Install Them On Devices
      • Manage IOS Apps
    • Android Apps
      • Add Android Apps And Install Them On Devices
      • Manage Android Apps
    • Windows Apps
      • Install Windows Apps On Devices
  • Applications
    • View Applications Installed On Android And IOS Devices
      • Blacklist And Whitelist Applications
    • Patch Management
      • Manage OS Patches On Windows Endpoints
      • Install 3rd Party Application Patches On Windows Endpoints
        • EM Supported 3rd Party Applications
    • View And Manage Applications Installed On Windows Devices
      • Uninstall A Windows Application From Selected Devices
      • Uninstall A Windows Application From All Devices
    • Vulnerability Management
  • License Management
    • Manage Your Licenses
    • Manage License Allocation
    • Bill Forecast
  • Configure Endpoint Manager
    • Email Notifications, Templates And Custom Variables
      • Configure Email Templates
      • Configure Email Notifications
      • Create And Manage Custom Variables
      • Create And Manage Registry Groups
      • Create And Manage COM Groups
      • Create And Manage File Groups
      • View And Manage Pattern Variables
      • View And Manage Keyword Groups
    • Endpoint Manager Portal Configuration
      • Import User Groups From LDAP
      • Configure Communication And Security Client Settings
        • Configure The EM Android Client
          • Configure Android Client General Settings
          • Configure Android Client Antivirus Settings
          • Add Google Cloud Messaging (GCM) Token
        • Add Apple Push Notification Certificate
        • Configure Windows Clients
          • Configure Communication Client Settings
          • Configure Client Security Settings
      • Manage Endpoint Manager Extensions
      • Configure Endpoint Manager Reports
      • Device Removal Settings
      • Account Security Settings
      • Set-up Administrators Time Zone And Language
      • Configure Audit Log Settings
    • Integrate Apple DEP With Endpoint Manager
      • Link Endpoint Manager With Apple DEP
      • Manage Apple DEP Devices
      • Manage Apple DEP Profiles
      • Configure Apple DEP Notifications
    • View Version And Support Information
  • Appendix 1a - Endpoint Manager Services - IP Nos, Host Names And Port Details - EU Customers
  • Appendix 1b - Endpoint Manager Services - IP Nos, Host Names And Port Details - US Customers
  • Appendix 2 – Endpoint Manager License Types
  • Appendix 3 - Pre-configured Profiles
  • About ITarian

View Mac Device Logs


Click 'Devices' > 'Device List' > 'Device Management' > click the name of a Mac device > 'Logs'

  • The 'Logs' tab shows all events that occurred on a specific device.
  • This contrasts to 'Dashboard' > ‘Audit Logs’, which shows events on all devices.


View device logs

  • Click 'Devices' > 'Device List'
  • Click the 'Device Management' tab in the top-menu
  • Select a company or a group to view just their devices
OR
  • Select 'Show all' to view every device enrolled to EM
  • Click the name of a Mac OS device
  • Click the 'Logs' tab


There are three types of logs, each shown on a different tab. Each row on these tabs is a specific event.


Click on the following for details about each type of log:

  • Alert Logs
  • Monitor Logs
  • Procedure Logs

    Alert Logs

    A record of all events where an alert was generated on the endpoint. For example, logs are generated a breach of monitoring conditions.
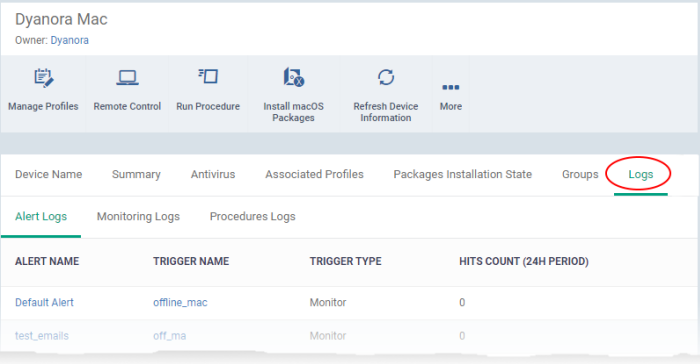
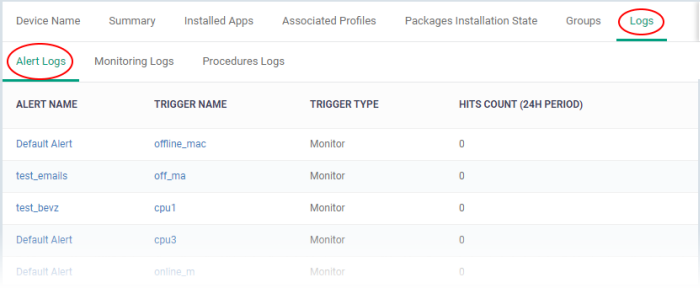

    View alert logs

    • Click 'Devices' > 'Device List'
    • Click the 'Device Management' tab in the top menu
    • Select a company or a group to view just their devices

    Or

    • Select 'Show all' to view every device enrolled to EM
    • Click the name of the Mac OS device then select the 'Logs' tab
    • Select 'Alert Logs'


    Alert Logs - Table of Column Descriptions

    Column Heading

    Description

    Alert Name

    The alert template used in the event.

    • An alert template is just a collection of settings that determines alert recipients, information included, priority etc. The template does not specify the condition under which the alert is generated.
    • The 'Trigger Name' is the actual monitor that generated the alert.
    • In the standard workflow, all monitors have the 'Default Alert' template applied to them. Click 'Configuration' > 'Templates' > 'Alerts' > 'Default Alert' to view the settings in the default template.
    • You can also create your own alert templates. See 'Manage Alerts' for more details.
    • Click the alert name to view and configure its settings.

    Trigger Name

    The monitor that generated the alert.

    • You can create a monitor to watch activity on a device and alert you if certain conditions are met.
    • For example, ‘alert me if disk usage exceeds 90%’ on a device.
    • Click the monitor name to view and configure its settings
    • See Manage Monitors for more details.

    Trigger Type

    The possible value is 'Monitor'.

    Hits Count (24 H Period)

    The number of times this condition was triggered in the past 24 hours.


    Monitor Logs

    • Monitors are scripts which keep track of specific items on a device. For example, you may set a monitor to track disk usage does not exceed a certain percentage.
    • Monitors can be added to the 'Monitoring' section of a configuration profile
    • Monitoring logs are shown for the past 24 hours.
    • See Monitors for Mac OS Devices for help to create monitors.
    • See Monitor settings for Mac OS Profile for help to add monitors to profiles

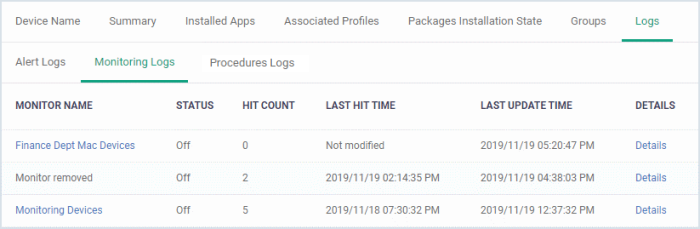
    View monitoring logs

    • Click 'Devices' > 'Device List'
    • Click the 'Device Management' tab in the top-menu
    • Select a company or a group to view just their devices

    Or

    • Select 'Show all' to view every device enrolled to EM
    • Click the name of the Mac OS device then select the 'Logs' tab
    • Click 'Monitoring Logs'


    Monitoring Logs - Table of Column Descriptions

    Column Heading

    Description

    Monitor Name

    The monitor that was triggered to create the log.

    • Click the name to view and manage the conditions of the monitor.
    • See Manage Monitors for more details. 

    Status

    Whether or not the monitor is currently active on the device.

    Hit Count

    The number of times the monitored condition was breached in the last 24 hours.

    Last Hit Time

    Date and time the condition was last broken.

    Last Update Time

    Date and time when the information was last refreshed.

    Details

    • Click the 'Details' link to view a log of the breach events.
    • See View Details of Monitoring Logs (given below) for more information. 


    Monitor Details

    • Click the 'Details' link to view event information and the conditions of a monitor:


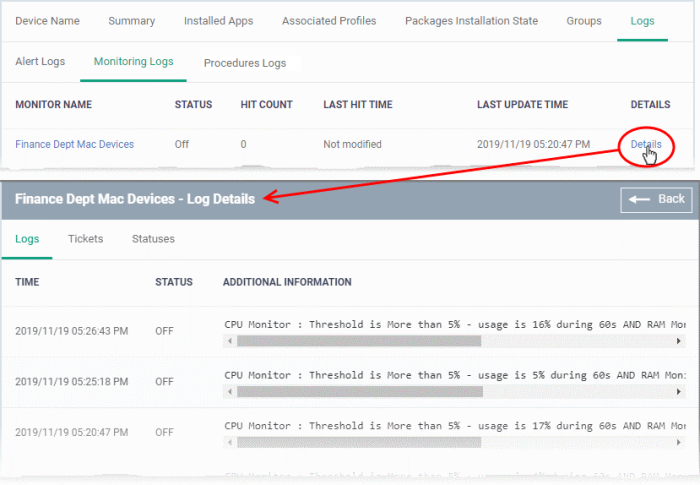
    Details are shown under three tabs:


    Logs - The date and time when the event occurred. Also shows details about the monitoring rule that detected the event.

    Monitoring Log Details - 'Logs' tab - Table of Column Descriptions

    Column Heading

    Description

    Time

    Date and time of the event.

    Status

    The current status of the monitored condition on the device.

    Additional Information

    Details on the condition monitored and the breach.


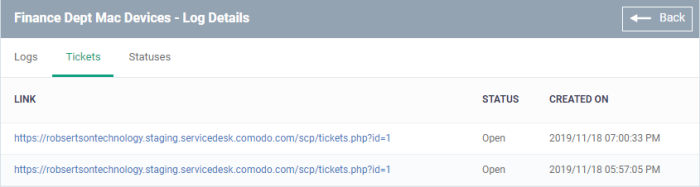
    Tickets - Shows any service desk tickets created by the events.


    Monitoring Log Details - 'Tickets' tab - Table of Column Descriptions

    Column Heading

    Description

    Link

    A link to the support ticket created for the breach event.

    • Click the link to open the ticket in service desk.

    Status

    Indicates whether the ticket is open or closed.

    Created On

    The date and time at which the ticket was created.


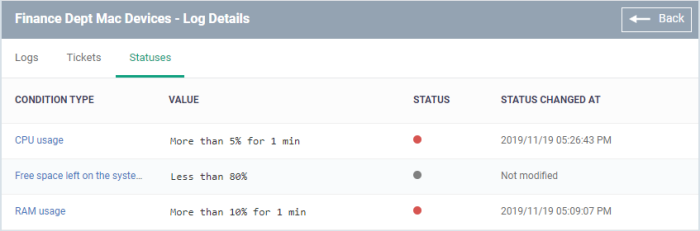
    Statuses - Shows the current status of all conditions monitored on the device.


    Monitoring Log Details - 'Statuses' tab - Table of Column Descriptions

    Column Heading

    Description

    Condition Type

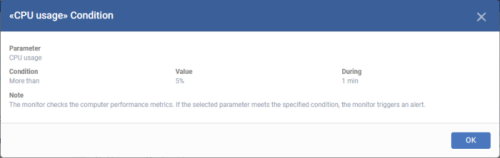
    The observed parameter of the monitor.


    Click the condition to view the details of the monitored parameter and configured thresholds. An example is shown below:


    Value

    The thresholds set for the parameter.

    Status

    Current state of the monitored parameter.

    • Green - The device is operating within the thresholds of the monitored condition
    • Grey - Unknown
    • Red - The device is exceeding the thresholds of the monitored condition. 

    Status Changed at

    The date and time of the most recent change to the monitor status.


    Procedure Logs

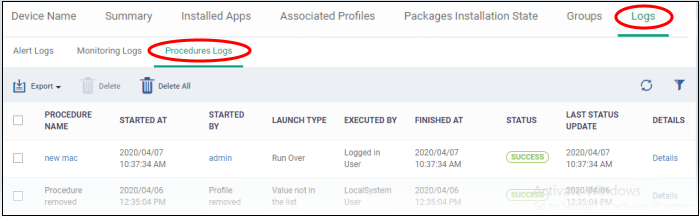
    The procedures log tab shows scripts that were manually run on Mac devices as well as those run automatically via a profile. For help to create and run script procedures, see Manage Procedures.

    • Click 'Devices' > 'Device List'
    • Click the 'Device Management' tab in the top-menu
    • Select a company or a group to view just their devices
    Or
    • Select 'Show all' to view every device enrolled to EM
    • Click the name of the Mac device then select the 'Logs' tab
    • Click 'Procedures Logs'


    Procedure Logs - Table of Column Descriptions

    Column Heading

    Description

    Procedure Name

    The label of the script procedure that was run on the device.

    • Click the procedure name to view the parameters of the script.
    • See Manage Procedures for more details.

    Started At

    The date and time when the procedure commenced.

    Started By

    Who or what launched the procedure.

    • A profile name will be shown here if the procedure was scheduled in a profile which is active on the device.
    • An admins name or email address will be shown if the procedure was run manually. Click the name/email address to view the details of the admin.

    Launch Type

    Whether the procedure was scheduled or run manually.

    Executed By

    The user account type used by Endpoint Manager to run the procedure.

    Finished At

    The date and time when the procedure was completed.

    Status

    Whether the script was successful or not.

    You can configure an alert if a procedure deployment fails. See 'Manage Procedures' for help with this.

    Last Status Update

    The date and time when the information was last updated.

    Details

    • Click the 'Details' link to view a log of the procedure's execution.
    • See the explanation of View Details of Script Procedure Logs given below.


    View Script Procedure Log details

    • Click the 'Details' link to view details about a procedure's execution:


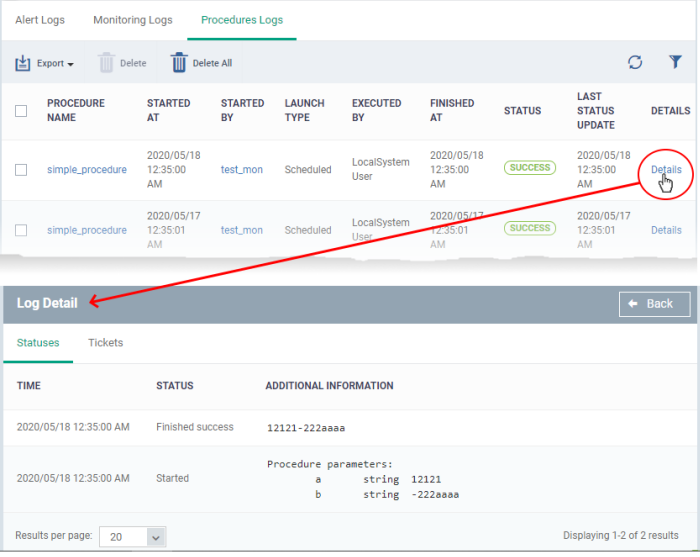
    The details are displayed under two tabs:


    Statuses - The date and time at which successive stages in the procedure were run, their success status and results.


    Script Procedure Log Details - 'Statuses' tab - Table of Column Descriptions

    Column Heading

    Description

    Time

    The date and time of the procedure execution.

    Status

    Whether the execution was successful or not.

    Additional Information

    Provides details on the execution:

    • If successful, displays the results of the procedure execution
    • If failed, displays the reason for not running the procedure


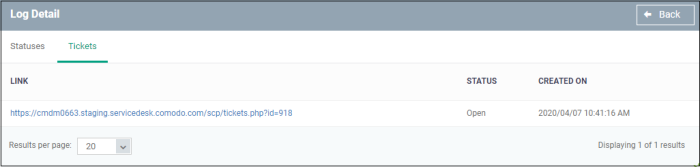
    Tickets - Displays tickets raised for any failed procedures.


    Script Procedure Log Details - 'Tickets' tab - Table of Column Descriptions

    Column Heading

    Description

    Link

    A link to the support ticket created for the breach event.

    • Click the link to open the ticket in service desk.

    Status

    Indicates whether the ticket is open or closed.

    Created On

    The date and time at which the ticket was created.


    Comodo Help
    • IT Platform:
    • Help
    • Scripts
    • Wiki
    • Forum
    • Developer
    • RMM
    • Patch Management
    • Service Desk
    • ITSM
    • Managed Service Provider
    • Managed Detection and Response
    • Ticketing System
    • Helpdesk
    • ITIL

    Copyright 2025 Itarian